Will Mapplebeck reports on why inequality has levelled out – despite what the Left says.
The rich get richer, the poor get poorer – a favourite phrase of anyone who wants to criticise market economics. A simple message… appealing to our sense of fairness and injustice. It should be the raison d’etre of the left. But, as you’ll probably have guessed, it’s not quite simple as that. In fact, it’s incredibly complex.
One way of measuring inequality is by something called the Gini Coefficient. It sounds like a household robot from a 1960s TV show set in the future, but it’s actually the measure that economists use to work out the distribution of income – or in fact anything – across a society.
Now I’m not going to get involved in whether the Gini Coefficient is the best measure, it is not the only way to gauge relative wealth, but it appears to be the most widely used.

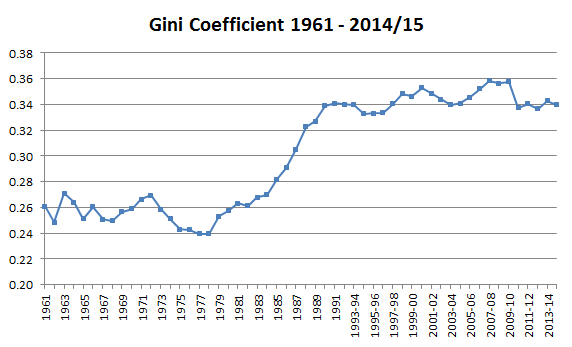
A quick look at the graph above – courtesy of the Equality Trust – gives us the broad picture. The co-efficient was relatively low during the swinging sixties, it fell lower during the economically troubled 1970s and then, around the mid 1980s, it rocketed. Britain wasn’t the only place in which it shot up, and economists argue over the causes. In the UK’s case it seems likely it was at least partly due to the Thatcher government’s successive income tax reductions plus a touch of laissez faire economics. It meant thousands more people got seriously rich.
However, after reaching its peak in the early 1990s, the Gini rises more slowly, reduces slightly in the wake of the 1992 recession and then fluctuates during the Blair years. But then, here’s the really surprising thing, as we go past the 2008 banking crisis, income inequality actually starts to reduce, taking us back to levels last seen in the late 1980s. This happened because the great recession resulted in rich people getting slightly less rich while poorer people are taken out of income tax thanks to one of the Coalition government’s more enlightened pieces of fiscal reform.
And that’s the problem for the left, inequality – by established measures – is actually falling, not by much, but still going in what most progressives would say is the right direction. There’s no guarantee this will continue, there’s some evidence that the top strata of the rich are beginning to pull away from the rest of us while at the same time average incomes will stagnate until at least 2020. In fact, many of the changes to benefits – which affect millions of working families – haven’t been felt fully yet. But for the moment, the Left has big problem. As the centre right argues, why does inequality matter as long as the poor’s incomes continue to grow while those at the top of the pile pay their share in tax? Everyone gets richer, everyone benefits.
And if the gap is decreasing anyway under a Conservative Government, where does the Left’s traditional redistribution argument go? Do you argue that you want to reduce it further and faster? That soon leads you into politically tricky territory; recently Jeremy Corbyn suggested capping the incomes of some unspecified high earners, and it didn’t play well. Plus the baby boomers who remember the golden age of income equality will be in their mid- to late-seventies by 2020 and that means a good chunk of the electorate won’t remember a time when incomes were more equal.
It’s hard to land blows with inequality unless people feel that it’s getting really bad or you cherry-pick some extreme examples – Philip Green and his yacht, for example.. Saying things are getting worse is a staple of opposition politics. But in the case of inequality, at the moment it’s simply not true.


Interesting
Shows that people see what they want to see.
The graph shows inequality rising significantly for the period 1961 to 2013/14, but the author sees only the slight downward movement in 2013/14.
He is using a detail of the graph to hide a glaringly obvious trend.
Also, based on a quick read I cannot tell whether he is looking at a gini coefficient for income or wealth.
My guess is income, otherwise where are the effects of the bull market in financial assets and houses from 2009 onwa